
So it’s been a while since I’ve had a chance to write anything here, but since it’s the holiday break, and I’m off work for a while, it’s been time to add new hardware to the rack, take care of things that have been needing to be done for a while, and really clean and tune things up.
One of the key things I wanted to do, was build up a proper graphing/monitoring setup for my setup. I built one for work a few years back, so I had the basics down, but wanted to see what was new too.
So I won’t go into detail on installing the packages, the 3 main components here are Grafana, InfluxDB & telegraf. All of these are free, and open source, and easily available, and easy to setup. I’m running mine on a Ubuntu VM, setup solely for this purpose. So just a basic Ubuntu 16 server install on a VMWare VM, from ISO, and basic network setup, nothing fancy, then install the above 3 packages.
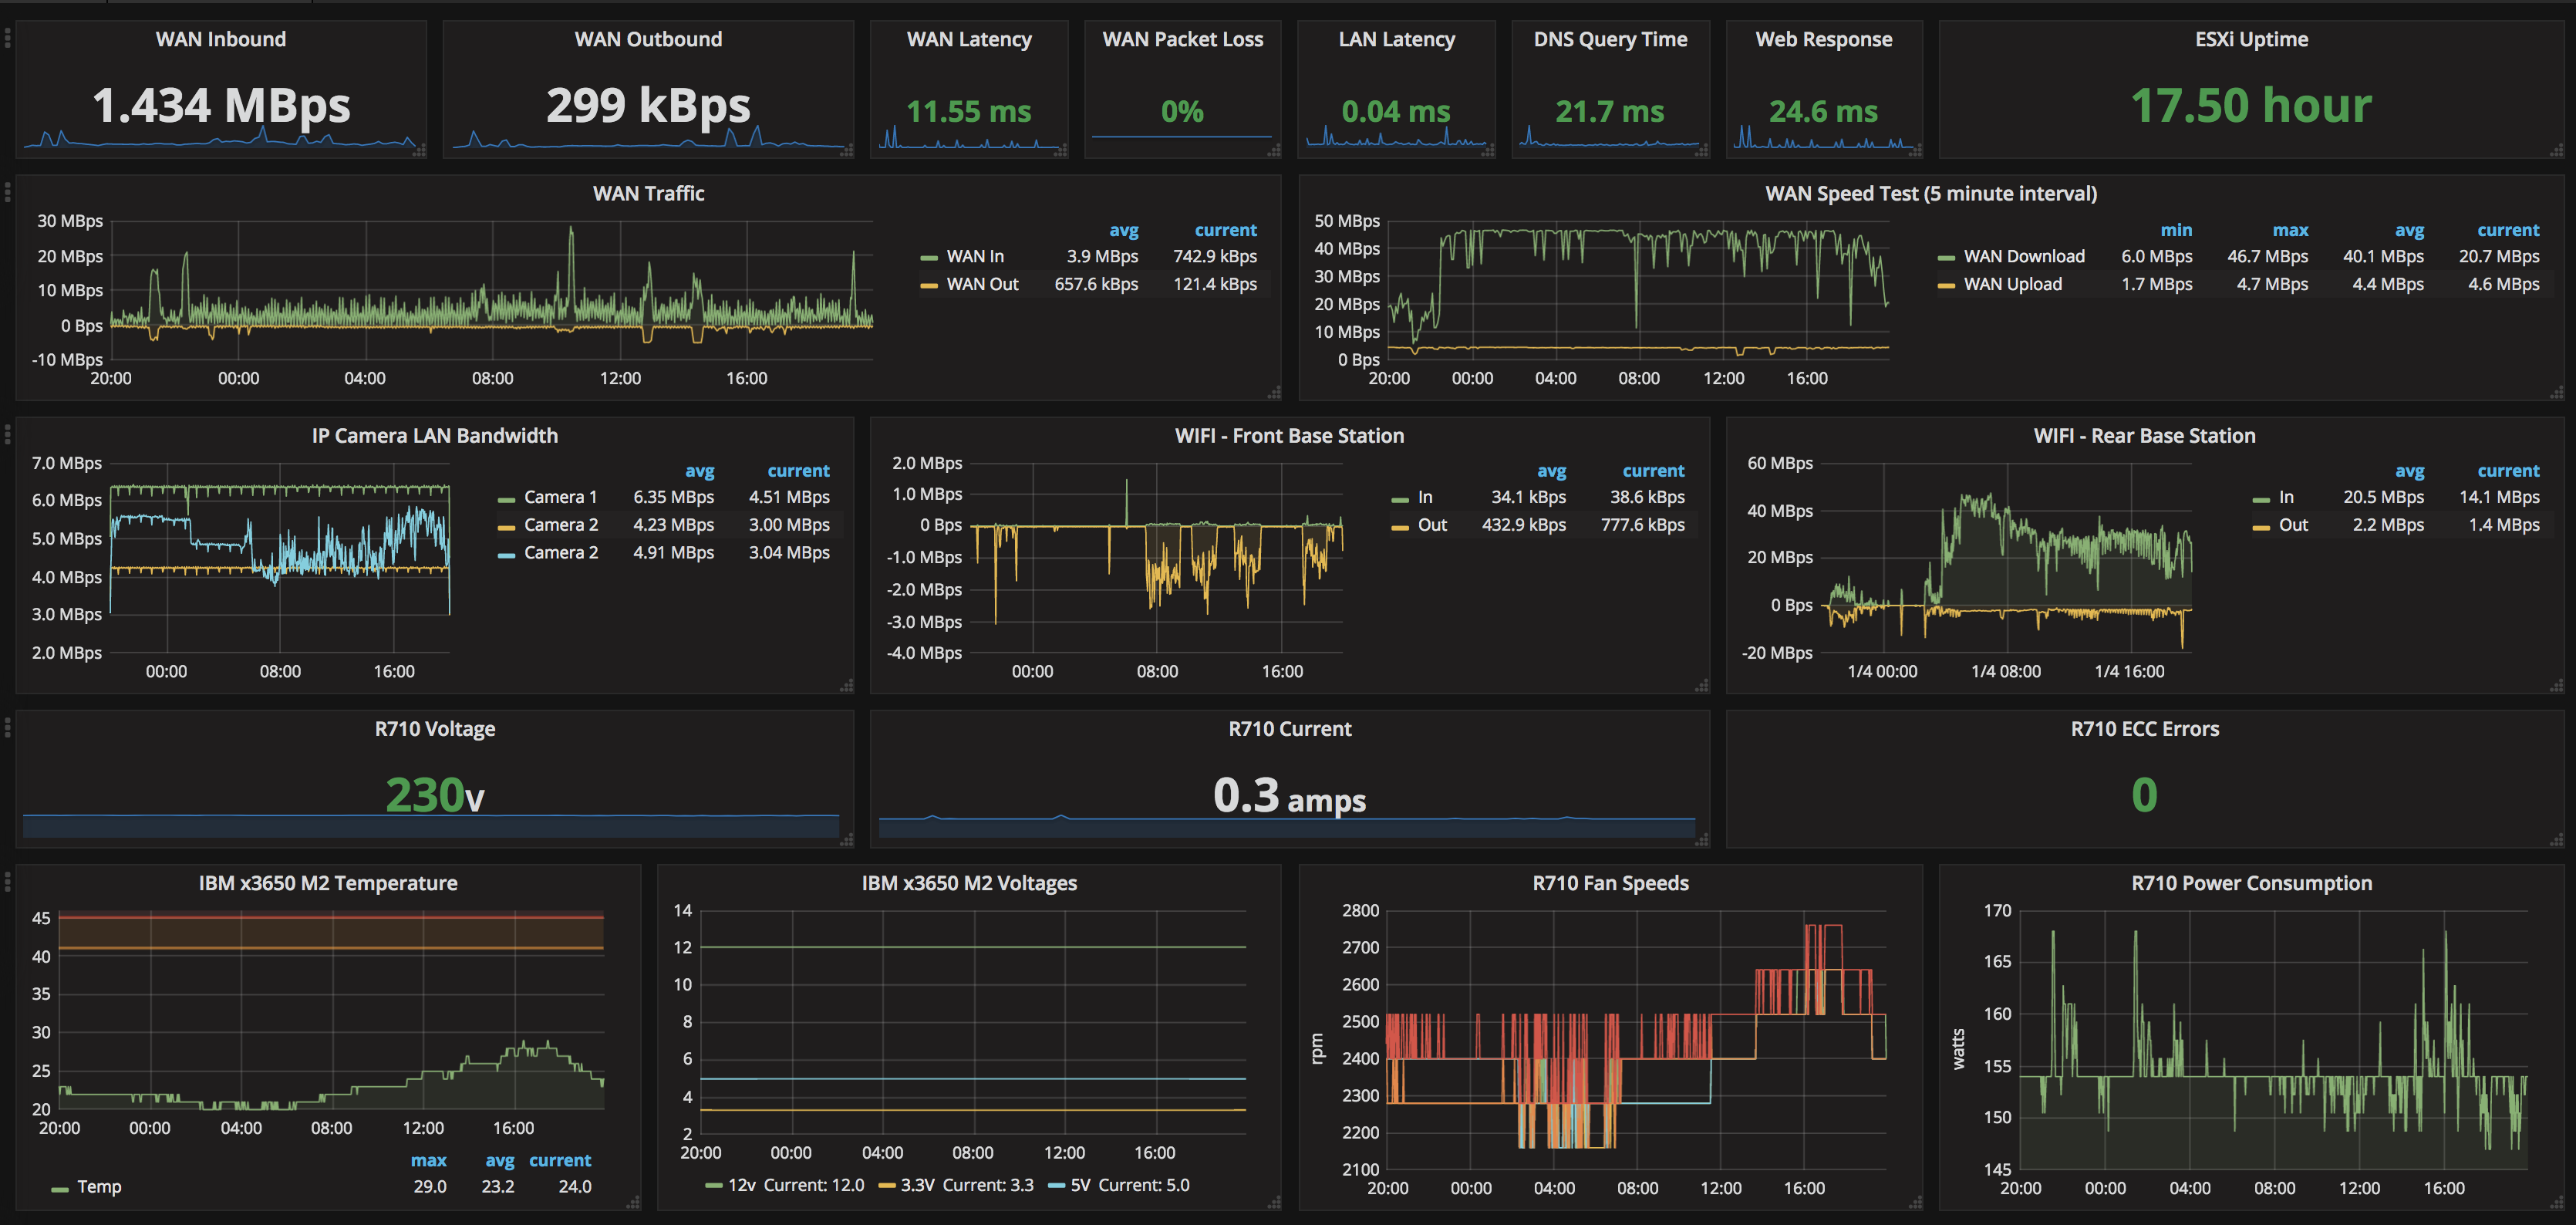
So, what does the dashboard look like?
 So, the hardware we’re working with here consists of:
Dell R710, with iDrac 6, running ESXi.
IBM x3650 M2, running FreeNAS
Cisco 2921 Router
We’re showing:
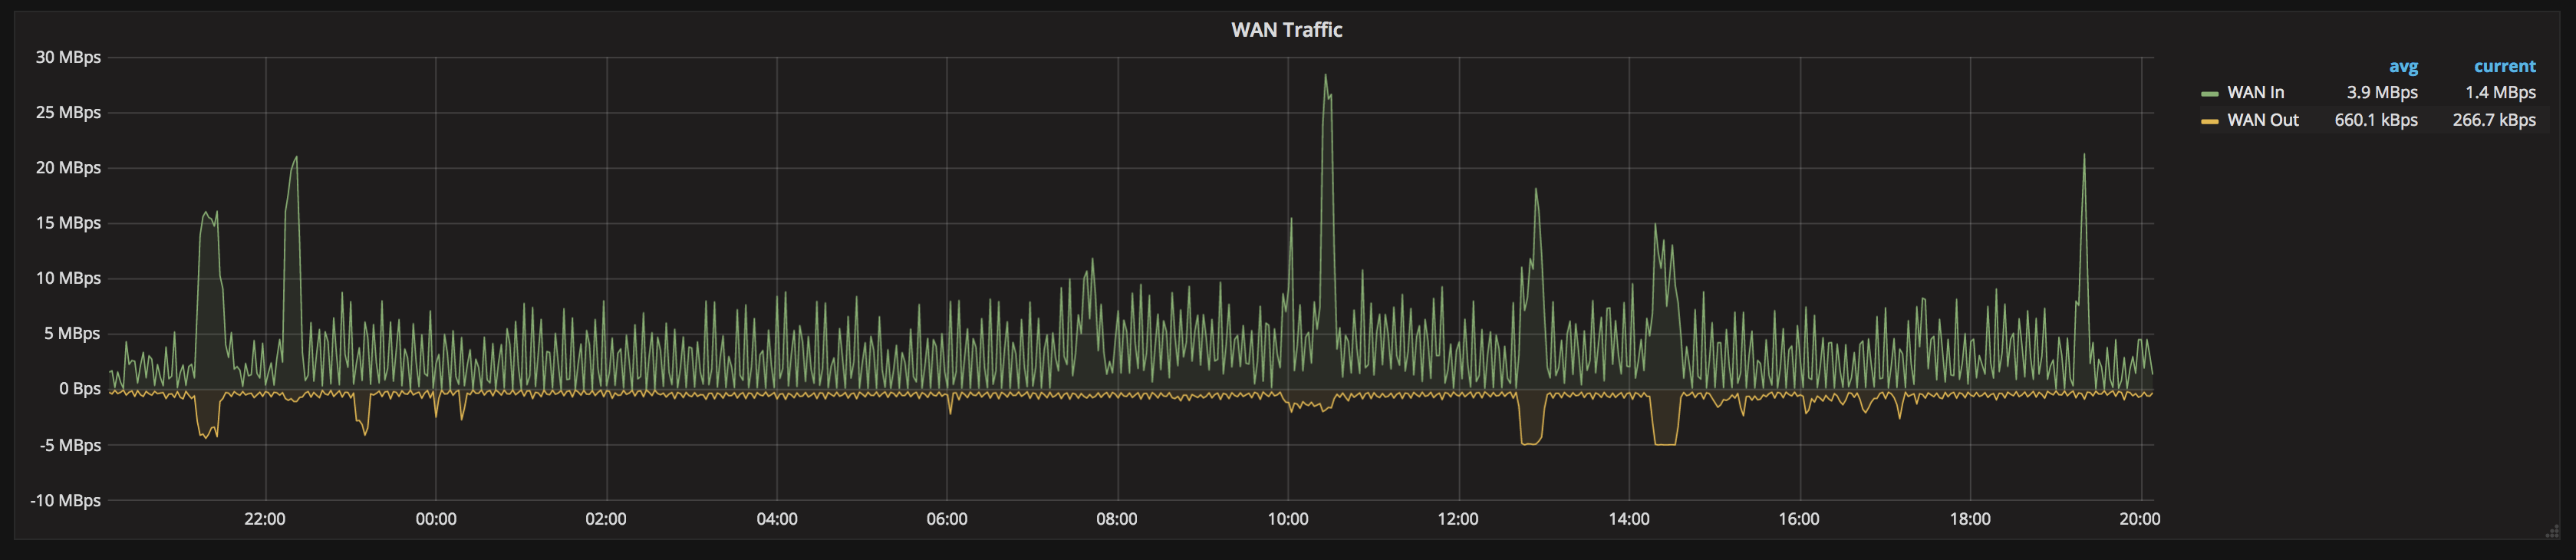
WAN Input/Output, live data, and historical graph data.
We’re gathering all interface data from the Cisco router (2921 in this case, but that’s to the way Cisco’s IOS works, this can be applied to pretty much any router, or switch)
We use Telegraph to get this from the Cisco via SNMP.
[[inputs.snmp]]
  agents = [ "192.168.1.254:161" ]
  version = 2
  community = "public"
  name = "snmp"

 [[inputs.snmp.field]]
    name = "hostname"
    oid = "RFC1213-MIB::sysName.0"
    is_tag = true

  [[inputs.snmp.table]]
    name = "snmp"
    inherit_tags = [ "hostname" ]
    oid = "IF-MIB::ifXTable"

    [[inputs.snmp.table.field]]
      name = "ifName"
      oid = "IF-MIB::ifName"
      is_tag = true
So this stores the hostname of the router as the tag “name”, and puts it in the default Telegraf database in Influx. Because the Cisco puts out effectively tabular data for the interfaces, importing it is very easy; Telegraf adapts it directly to tables in Influx to make gathering a lot of data with only a single poll straight-forward.
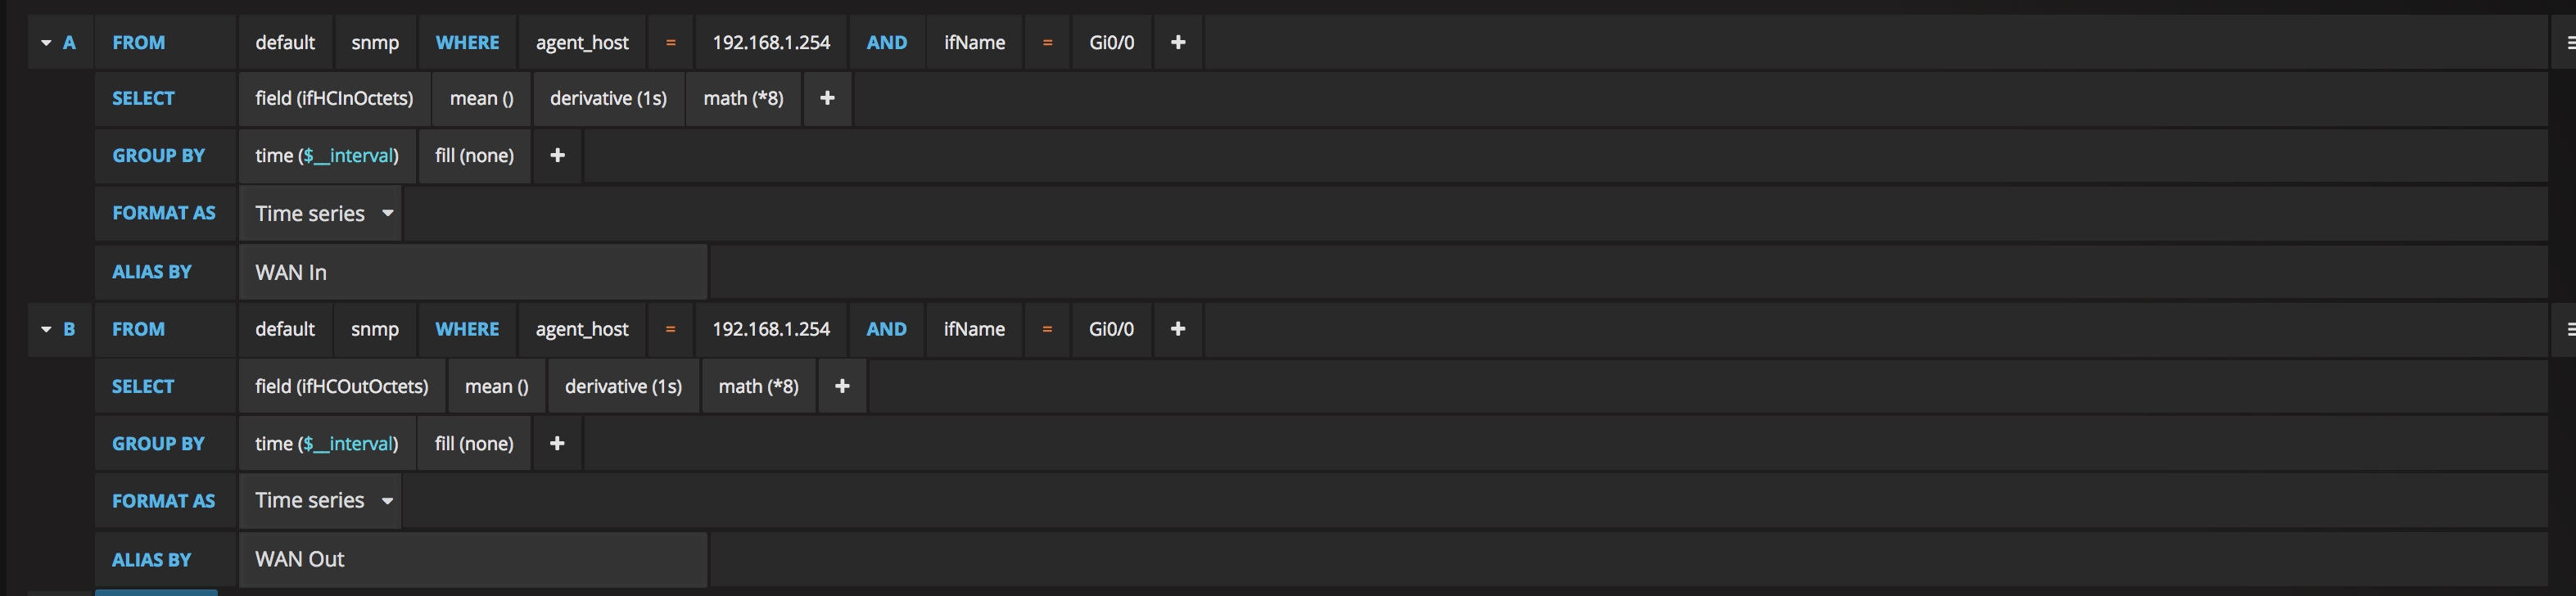
SELECT derivative(mean("ifHCInOctets"), 1s) *8 FROM "snmp" WHERE ("agent_host" = '192.168.1.254' AND "ifName" = 'Gi0/0') AND $timeFilter GROUP BY time($__interval) fill(null)
This is the query needed in Grafana to display that data, so the upper left Single Stat panel showing the WAN inbound. We use a math(*8) to take the data from bits to bytes. ifHCInOctets is the value/reading that we have, and we’re using the WHERE clause to filter it to a specific interface on the router. In this case, it’s Gi0/0. In some cases this may be a specifically named interface, depending on what your broadband uplink actually consists of.
Repeat the above for the OutOctets. (You can duplicate panels in Grafana once you’ve got one setup nicely, then just edit the query to the different value to save some time)
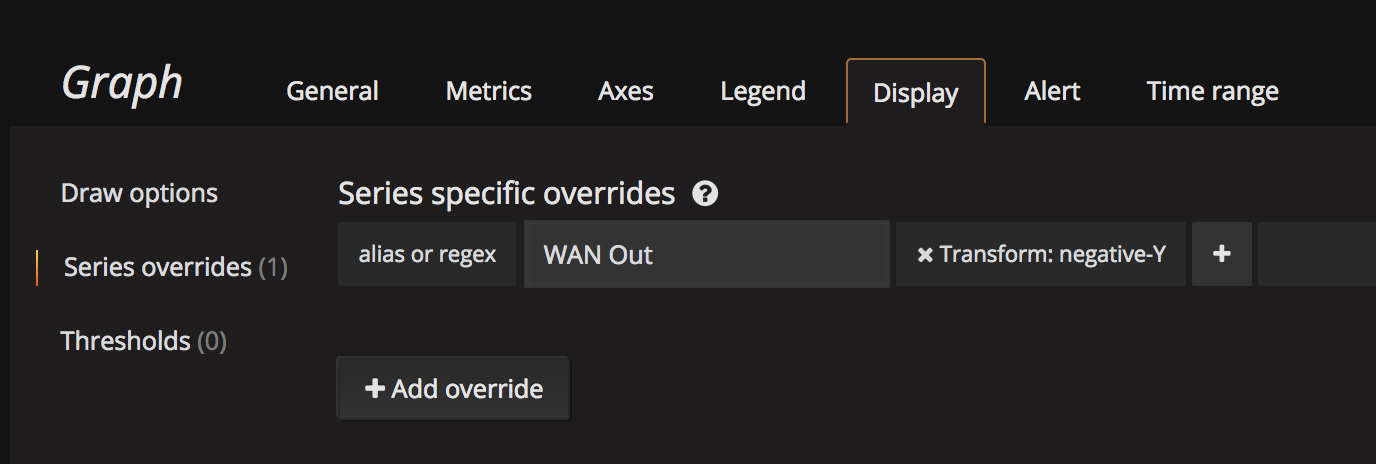
We use an identical query for the WAN historical graphs. I actually made 2 queries, so that IN and OUT can be considered separate graphs, then you can push the OUT traffic to the right axis if you wish, and also apply a negative transform. Some people I’ve seen use a negative value in the math (* -8 instead of * 8), however this makes your values in the legend negative as well, which bothers me so using negative transform you get it to do up/down graphs, but still show proper values in the table.
 The same logic and techniques are using to display the IP Camera & Wifi bandwidth. In my case I’m lucky that my router came equipped with an 8-port POE card, which means when I get the table of data from the router, I also get those 8 switch ports, which happens to be where the IP Cameras & Wifi base stations are attached. A lot of switches will also report the per-port data, so if you’ve got a SNMP enabled switch, you can likely also do this, by pulling data from that device.
The WAN & LAN Latency are done by built-in functions of Telegraf itself.
[[inputs.ping]]
   urls = ["www.google.com","192.168.1.1"]
In this case, I’m pinging google to read as WAN Latency, and a local IP to get LAN Latency. Packet loss and a number of other metics come from this collection as well.
DNS Query time comes from:
 [[inputs.dns_query]]
   servers = ["8.8.8.8"]
   domains = ["www.google.com"]
   record_type = "A"
In this case I have it querying google.com via google’s own DNS servers. Gets a very good response time. You’ll find some other domains get varying response times, even ones using CloudFlare, which was an interesting discovery.
Web latency is measured by:
[[inputs.net_response]]
   protocol = "tcp"
   address = "www.google.com:80"
   timeout = "1s"
   read_timeout = "1s"
Again, I’m just hitting google here as a WAN metric. It’s worth keeping in mind, if you host a website, and want to monitor THAT with a dashboard, most of these tools can be used to give a good idea of what your website is doing.
Next up, the Dell R710 hardware monitoring. Now I have had temperatures visible in my iDrac in the past, however, right now, I cannot get it to work. It doesn’t even show temperatures in my iDrac interface at all. I get zero’s back on those readings via IPMI, so there is no graph for that one here at this stage.
Telegraf allows for pulling IPMI data over LAN. You need to enable this function in the iDrac interface first, but otherwise fairly straightforward. Note the use of LANPLUS mode for the iDrac, it doesn’t work on “LAN”.
[[inputs.ipmi_sensor]]
  servers = ["root:calvin@lanplus(192.168.1.10)"]
  interval = "30s"
  timeout = "20s"
Yes, that’s the iDrac default username and password. Change that to suit your own iDrac setup.
Note: SNMP is also supported by the iDrac, however you get virtually no meaningful data back from it that I can find.
Using this IPMI data however I’m showing input line voltage, current (amps), power consumption (watts), ECC error count, & fan speed.
The IBM x3650 M2 I’m showing via SNMP. I believe it will also support IPMI over LAN, so there is potential for more data here. I’ll expand on this if I get that to work.
This one is a bit messy to read, but pulls everything you see on the dashboard, and a little more.
[[inputs.snmp]]
        agents = ["192.168.1.4:161" ]
        version = 1
        community = "public"
        name = "IBMIMM"

        [[inputs.snmp.field]]
            name = "hostname"
            oid = "iso.3.6.1.2.1.1.6.0"
            is_tag = true

        [[inputs.snmp.field]]
            name = "temp"
            oid = "iso.3.6.1.4.1.2.3.51.3.1.1.2.1.3.1"

        [[inputs.snmp.field]]
            name = "33v"
            oid = "iso.3.6.1.4.1.2.3.51.3.1.2.2.1.4.1"
        [[inputs.snmp.field]]
            name = "5v"
            oid = "iso.3.6.1.4.1.2.3.51.3.1.2.2.1.4.2"
        [[inputs.snmp.field]]
            name = "12v"
            oid = "iso.3.6.1.4.1.2.3.51.3.1.2.2.1.4.3"

        [[inputs.snmp.field]]
            name = "FAN1A"
            oid = "iso.3.6.1.4.1.2.3.51.3.1.3.2.1.3.1"
        [[inputs.snmp.field]]
            name = "FAN1B"
            oid = "iso.3.6.1.4.1.2.3.51.3.1.3.2.1.3.2"
        [[inputs.snmp.field]]
            name = "FAN2A"
            oid = "iso.3.6.1.4.1.2.3.51.3.1.3.2.1.3.3"
        [[inputs.snmp.field]]
            name = "FAN2B"
            oid = "iso.3.6.1.4.1.2.3.51.3.1.3.2.1.3.4"
        [[inputs.snmp.field]]
            name = "FAN3A"
            oid = "iso.3.6.1.4.1.2.3.51.3.1.3.2.1.3.5"
        [[inputs.snmp.field]]
            name = "FAN3B"
            oid = "iso.3.6.1.4.1.2.3.51.3.1.3.2.1.3.6"
Temperature is the ambient/intake temperature, and appears to be the only temperature this version of the IBM IMM tracks. Even the web interface only shows the single temperature. 3.3, 5 & 12v lines are reported here, but curiously, not input voltage, or consumption/wattage.
The fans were a bit of a disappointment here. I really wanted to graph those, and while SNMP gives me the data, in its raw format, it’s not usable. It returns the fans as STRING’s for some reason, with “33 %” as the value. I’m sure there are ways to pre-process this data, and strip/trim the “ %” from the end, but I haven’t gotten into that yet. I’m hoping that if I can get IPMI via LAN to work, I might get the fan speeds in a usable format natively.
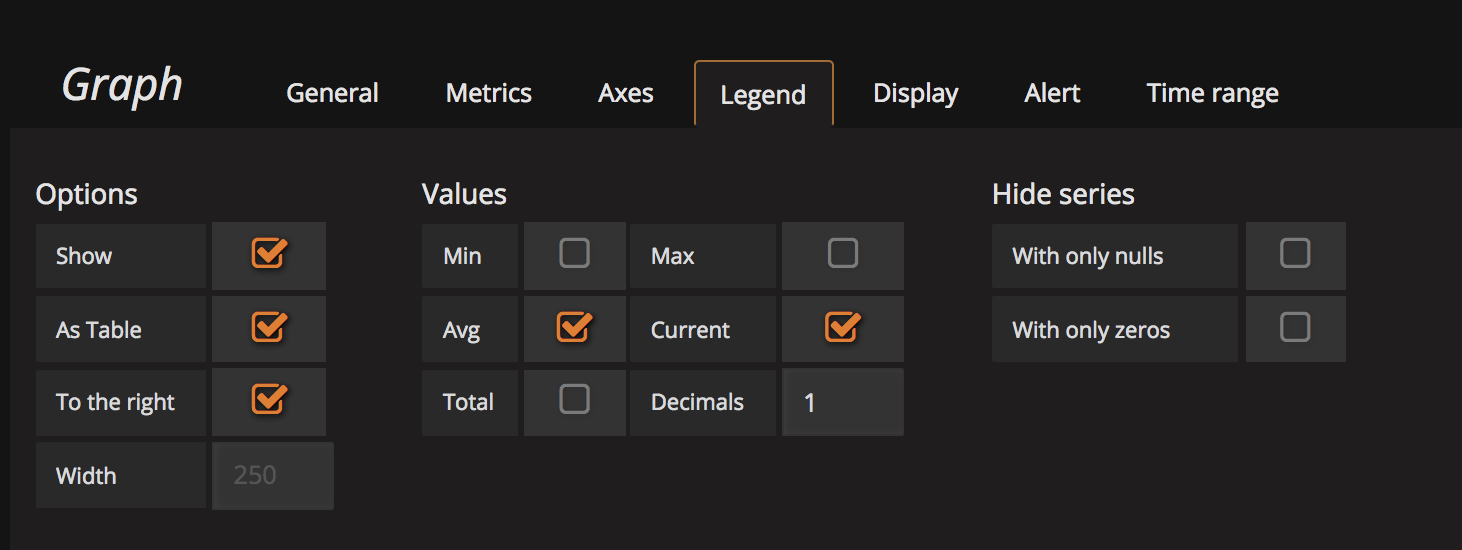
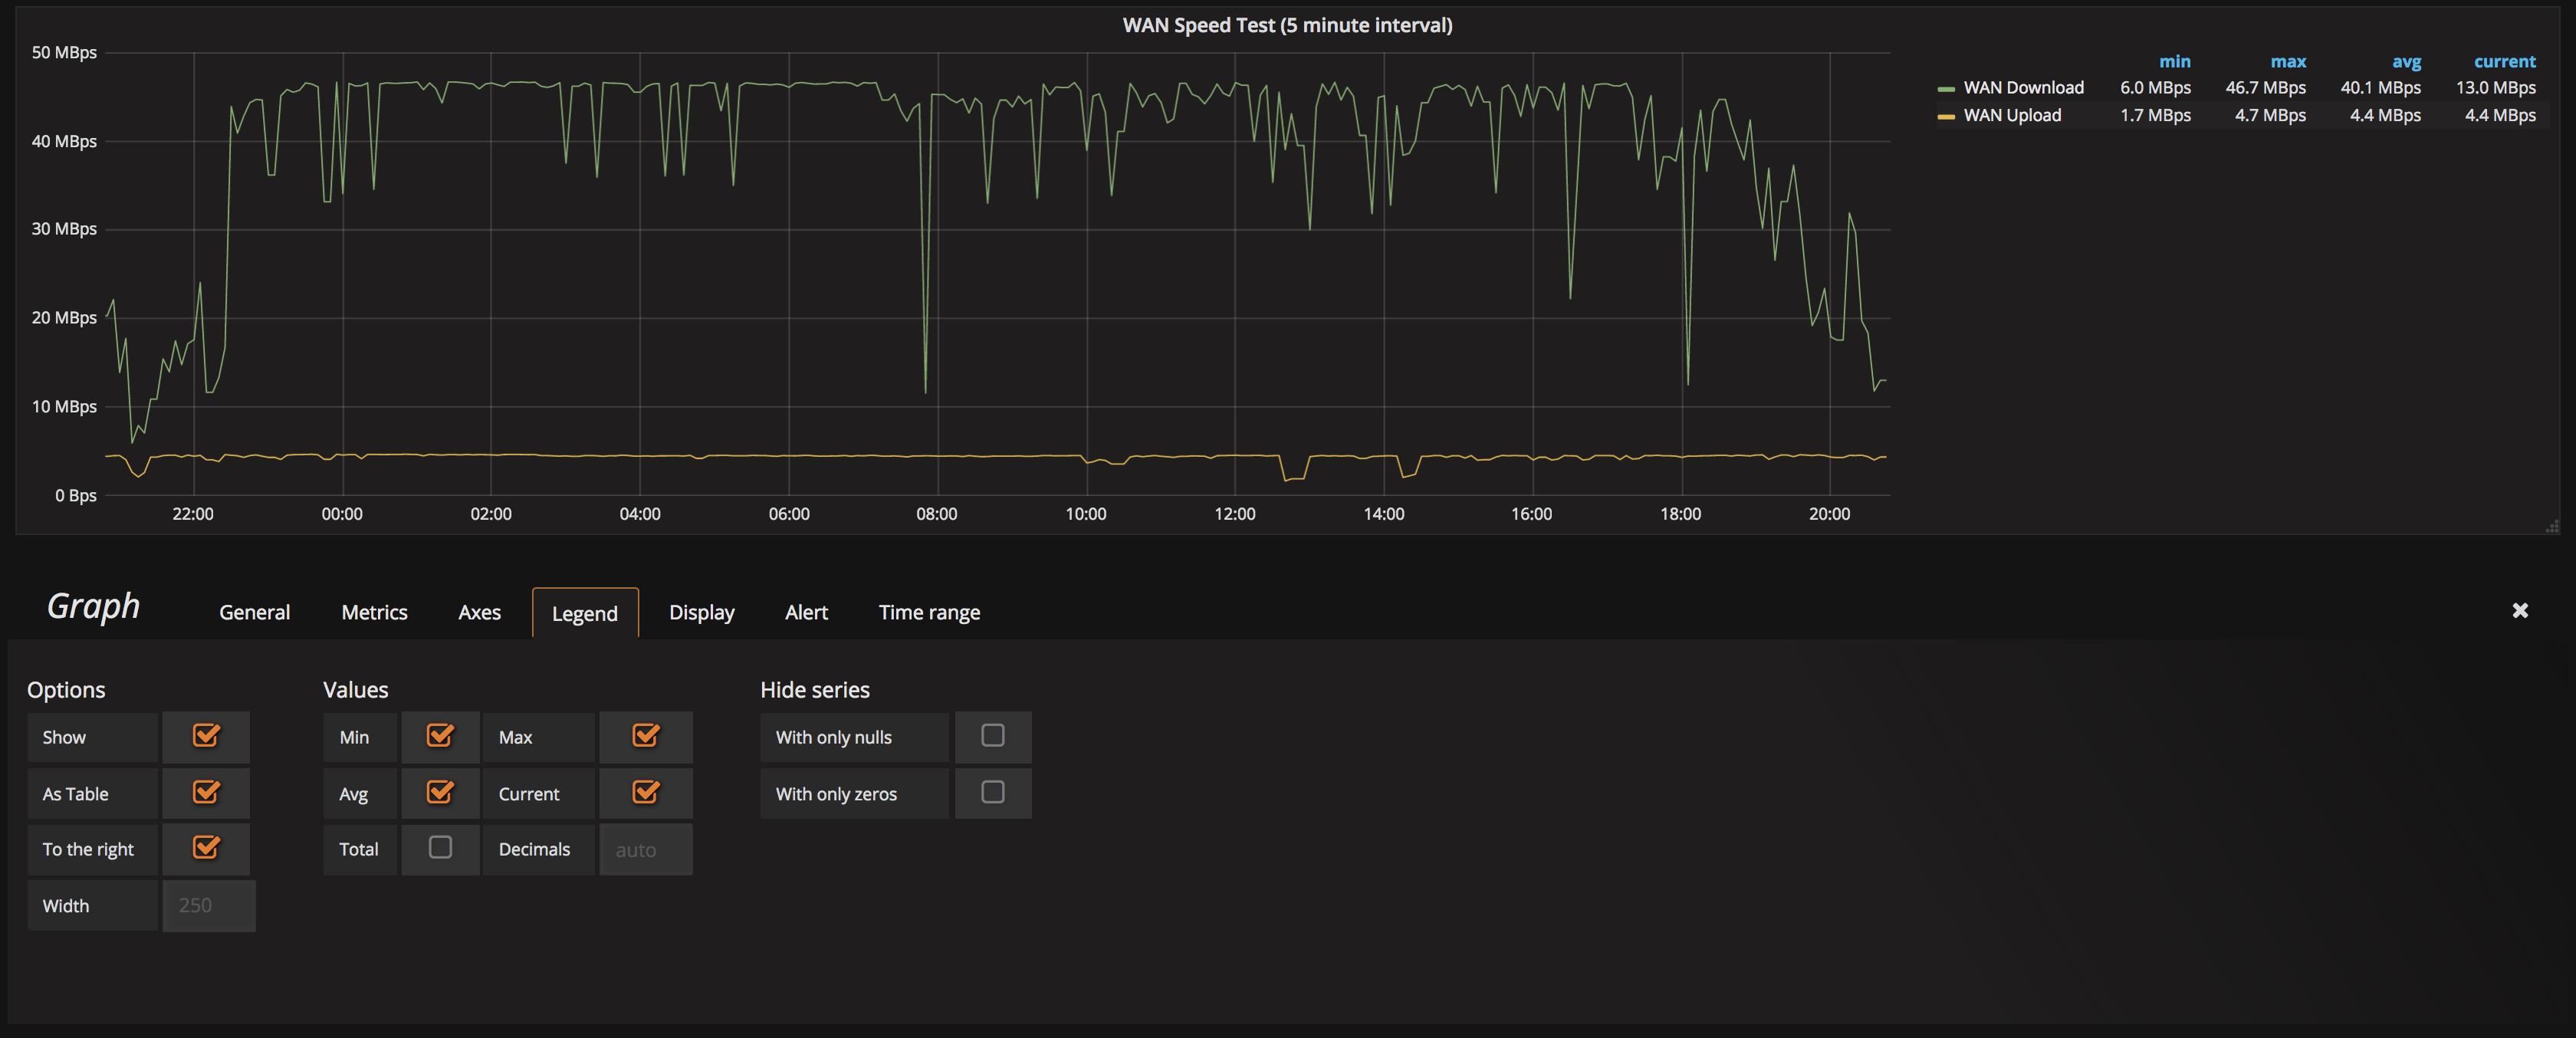
And finally, the WAN speed test. This is one that I was really happy to be able to include. I’m currently doing it every 5 minutes, as I don’t want to smash my bandwidth too much just on tests, but it’s nice to have the data visible. Even just here in the last 24 hours, you can see how much it dropped at peak evening time! I’m not sure if I’ll drop the interval back a bit as it moves forwards, I’m not actually sure how much data it consumes upon each test.
So, there is a linux tool called speedtest-cli. This is available on Ubuntu via apt-get, and should be easily available on other platforms without issue. It’s just a nice simple wrapper for the speedtest service.
So I made up 2 scripts. I copied the base concept of this from something I found partly on another blog I can’t recall now, but adapterd a bit to suit exactly what I needed.
The first script is a loop script. You could also use a cron job to run the primary script every 5 minutes, but this works.
#!/usr/bin/env sh

export INFLUXDB_DATABASE="speedtest"
export INFLUXDB_HOST="192.168.1.1"
export SPEEDTEST_FRQUENCY=300
export INFLUXDB_PORT=8086
export INFLUXDB_PASSWORD=""
export EXTRA_TAGS=""

while [ 1 ]
do
    logger Starting new test
    /opt/scripts/speedtest.sh

    sleep $SPEEDTEST_FRQUENCY
done
I launch this script on startup as a background thread, and basically all it does it call the actual speedtest script every 5 minutes. You can adjust the timing here, as well as the InfluxDB parameters.
#!/usr/bin/env sh

timestamp=$(date +%s%N)
hostname=$(hostname)

logger Current timestamp: $timestamp

output=$(speedtest-cli --simple)

logger Output: $output

line=$(echo -n "$output" | awk '/Ping/ {print "ping=" $2} /Download/ {print "download=" $2 * 1000 * 1000} /Upload/ {print "upload=" $2 * 1000 * 1000}' | tr '\n' ',' | head -c -1)
curl -XPOST "http://$INFLUXDB_HOST:$INFLUXDB_PORT/write?db=$INFLUXDB_DATABASE" -d "speedtest,host=$hostname$EXTRA_TAGS $line $timestamp"

logger New speedtest sent
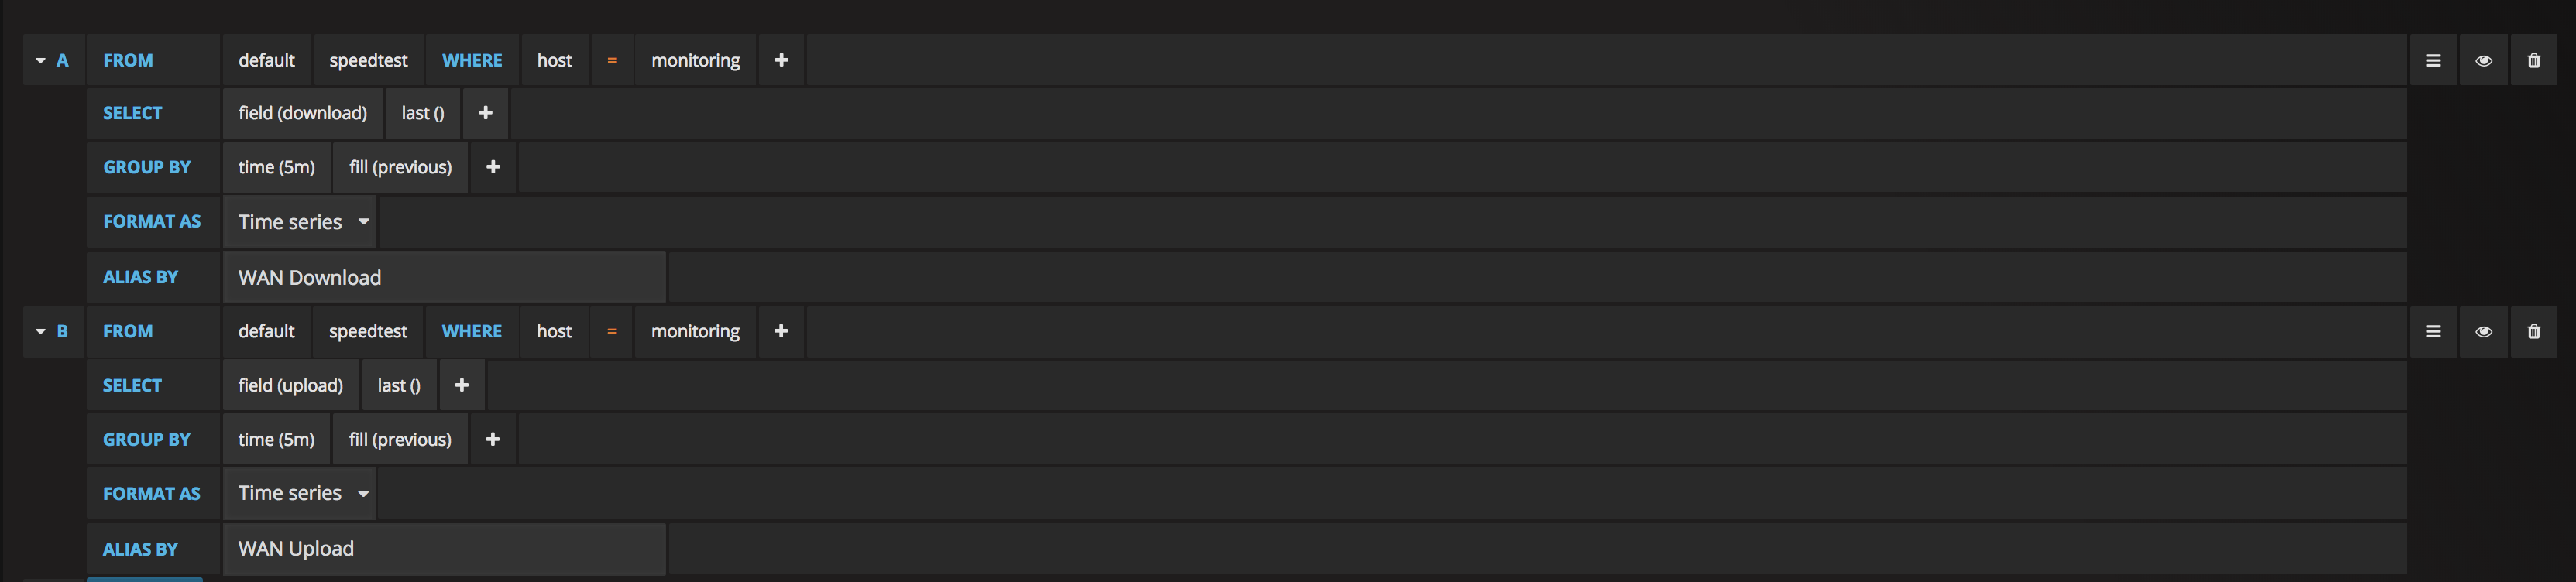
This one is the actual speedtest.sh script. This runs the speedtest-cli command, parses the response, and uses a HTTP POST to push the data into InfluxDB.
Then you can graph it just like any other metric.
What’s next?
I’m pretty happy with where I’ve got this to. And my primary reason for a home lab? Learning technologies to use at work. What I’ve built here I built in a quarter of the time compared to last time I did anything with Grafana, as I didn’t use Telegraf. I built a LOT of custom shell scripts and manual POSTS into InfluxDB. This time around, I’ve only had to do that once. This will help me to move forward with improving the systems I use at work too.
There’s more things I want to do on my homelab one here. To start with, there is a lot of data you can pull from ESXi, and since I’ve got the hypervisor running, I’d like to make a dashboard to show the health of that. I’d also like to show a ping panel for each of my VM’s, to specifically monitor their health directly.
My storage is run by FreeNAS (see previous blog post here on Fibre Channel), and there is a LOT of data that it can provide via it’s own CollectD agent.
I’m also replacing my Nortel switch with a HP Chassis switch (4208vl) in the coming days, so I’ll be experimenting with what SNMP data I can pull from that. Potentially per-port data to each host would be a great dashboard. I’m planning to move to using iSCSI for storage for ESXi, which will put storage traffic on it’s own sets of VLANs. Would be great to be able to show that traffic separate from LAN traffic.
Stay tuned, I’ll update a link here when I post the next step.